Loading India map…
Make sure india.json and india_states_final.json
are in the same folder as index.html.
Make sure india.json and india_states_final.json
are in the same folder as index.html.
31 of 36 Indian states have already crossed below the population replacement threshold. This is not a population explosion. It is a silent demographic collapse — unfolding at different speeds in different places, for reasons rooted in economics, culture, and the mathematics of the modern mating market.
Explore the Data ↓Click any state to see its full profile. Toggle between RSI (composite sustainability score) and TFR (fertility rate) views. Hover for a quick summary.
Ranked by the Regional Sustainability Index — a composite of population health, economic vitality, social cohesion, and geopolitical stability.
Fertility decline is not simply economics or education. It is the emergent result of millions of individually rational decisions — each locally sensible, collectively catastrophic.
As female education and income rise, reservation criteria for partners rise with them. The top 20% of men attract all available women. The bottom 40% are effectively priced out of the market. Delayed partnership mechanically reduces fertility — not by choice but by mathematics.
Having children in a competitive urban economy is individually costly and collectively necessary. Each couple choosing not to have children is rationally defecting. When enough couples defect, the Nash equilibrium produces demographic collapse — even in societies that value children culturally.
When TFR falls below replacement for a generation, the working-age population shrinks relative to the elderly. Higher dependency costs make having children even less affordable for the next generation. South Korea is already inside this trap. India's developed south is entering it.
Phase 1 analysis of NFHS-5 state-level data, GDP per capita, and the Regional Sustainability Index reveals three distinct demographic Indias coexisting within one political boundary.
Kerala and Tamil Nadu — long below replacement — show a positive TFR change of +0.1 to +0.2. Fertility is ticking back up after decades of decline. This rare global pattern may suggest these states are finding a natural floor around 1.8, driven by improved female economic security rather than policy intervention.
Meghalaya holds a TFR of 2.9 with almost no change, in a high-education, majority-Christian, matrilineal tribal state. It mirrors Israel's anomaly exactly: strong community identity, religious cohesion, and cultural valuation of children as community survival rather than personal lifestyle choices.
"The societies that maintain replacement-level fertility are those that have maintained a shared narrative about why children matter — to the community, not just the individual couple."
India's richest state by total GDP dramatically underperforms its wealth, scoring 7.7 RSI points below what its GDP would predict. Wealth concentrated in Mumbai while 112 million people across the state have uneven access to infrastructure, healthcare, and opportunity.
Both states recorded a TFR drop of exactly −1.0 in a single survey cycle — roughly 5 years. South Korea's catastrophic fertility collapse took three decades. These states appear to have compressed that transition into one generation, driven by rapid modernization without cultural adaptation infrastructure.
Bihar has the lowest GDP in the dataset yet still underperforms expectations by 9.9 RSI points. Its TFR of 3.0 is falling at −0.4 per cycle. When it crosses below replacement — likely within two survey cycles — it will face an aging population crisis without Kerala's remittance economy or healthcare base to absorb it.
Seven charts built from NFHS-5, World Bank, and Our World in Data sources. Each answers a different question about India's demographic trajectory and how it compares to the rest of the world.
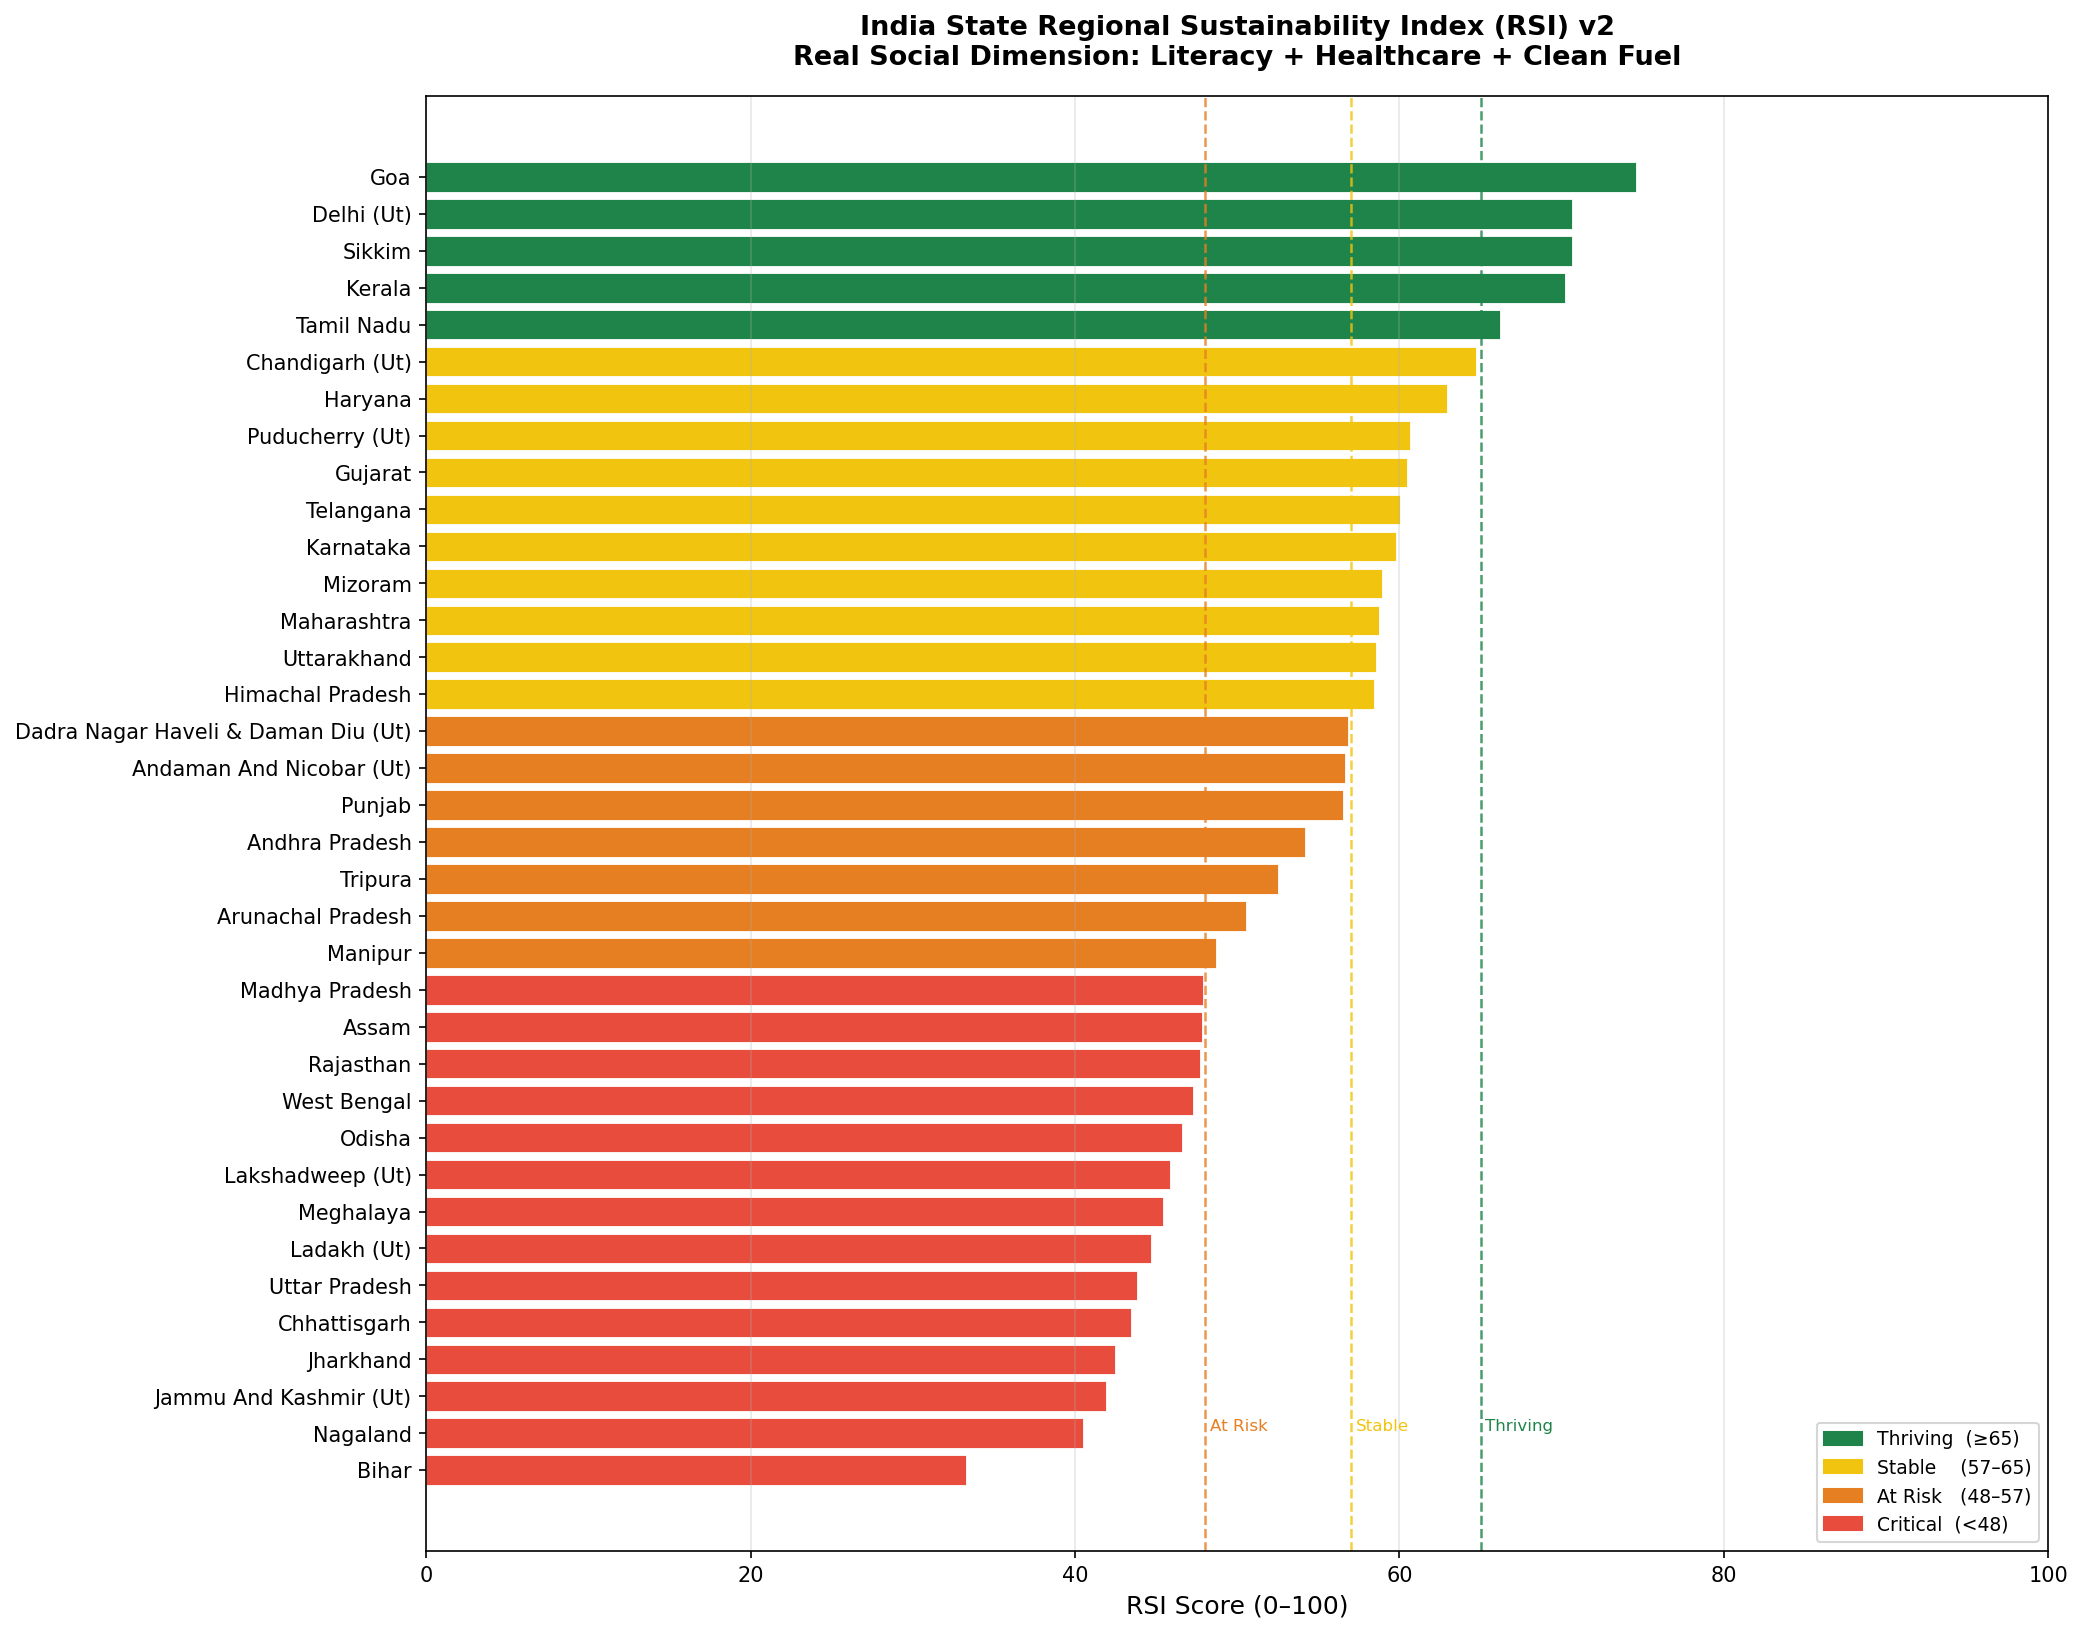
Composite score across population health, economic vitality, and social development (real literacy + healthcare data). Goa, Delhi, and Sikkim lead. Bihar and Nagaland are in the critical band.
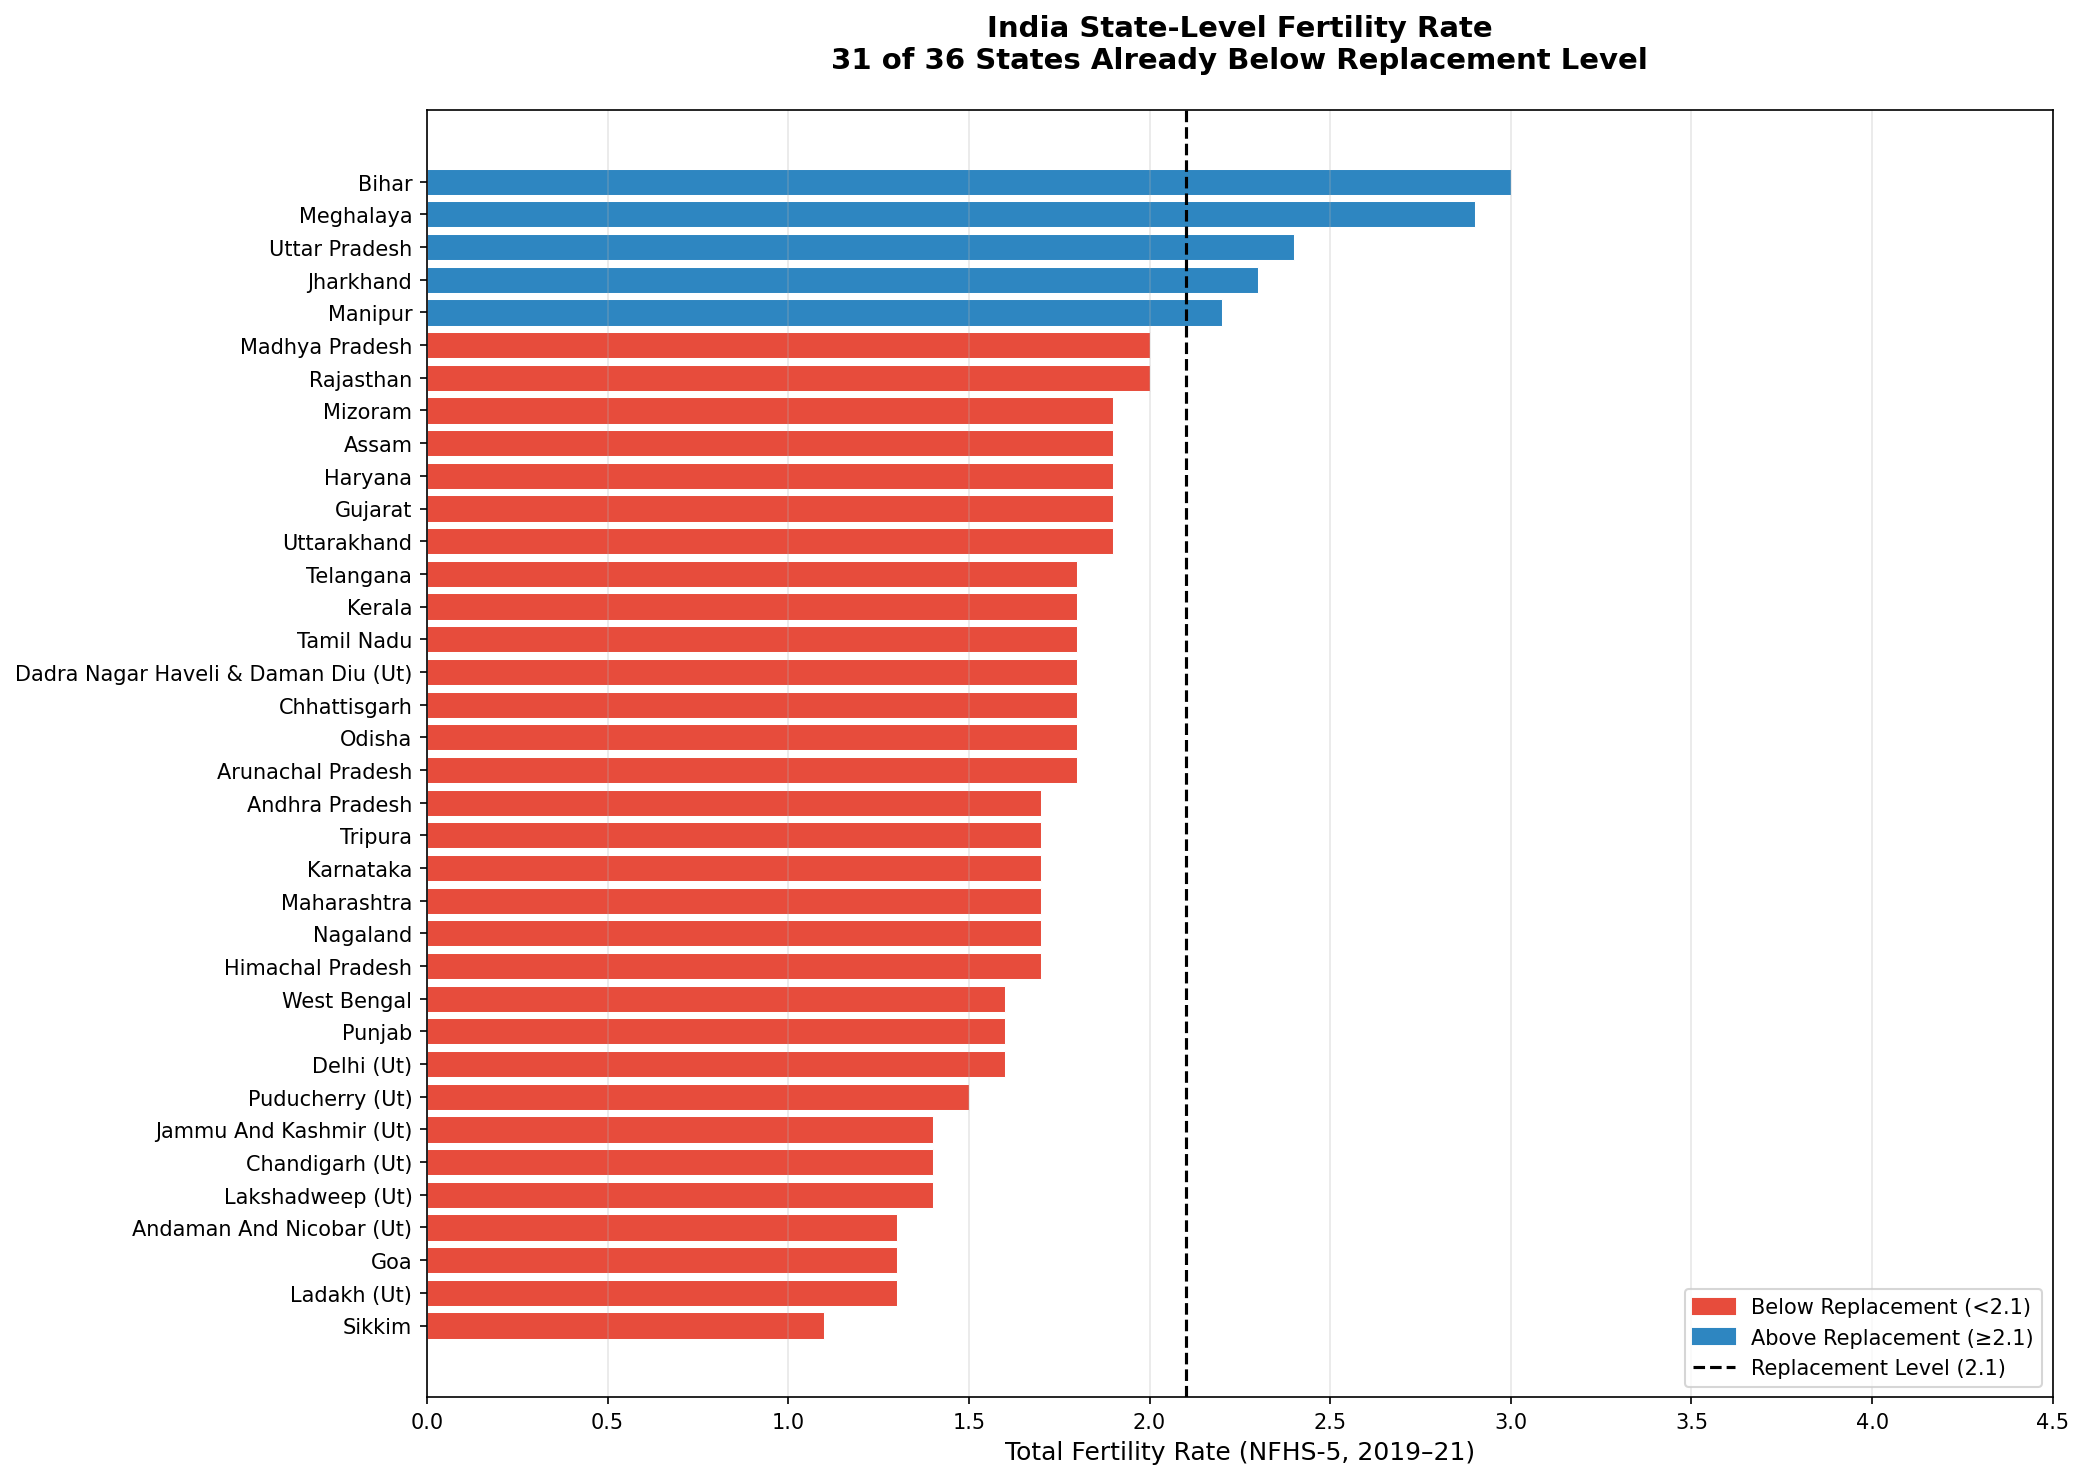
The population explosion narrative is obsolete. Most of India is already in demographic decline territory as of the 2019–21 survey.
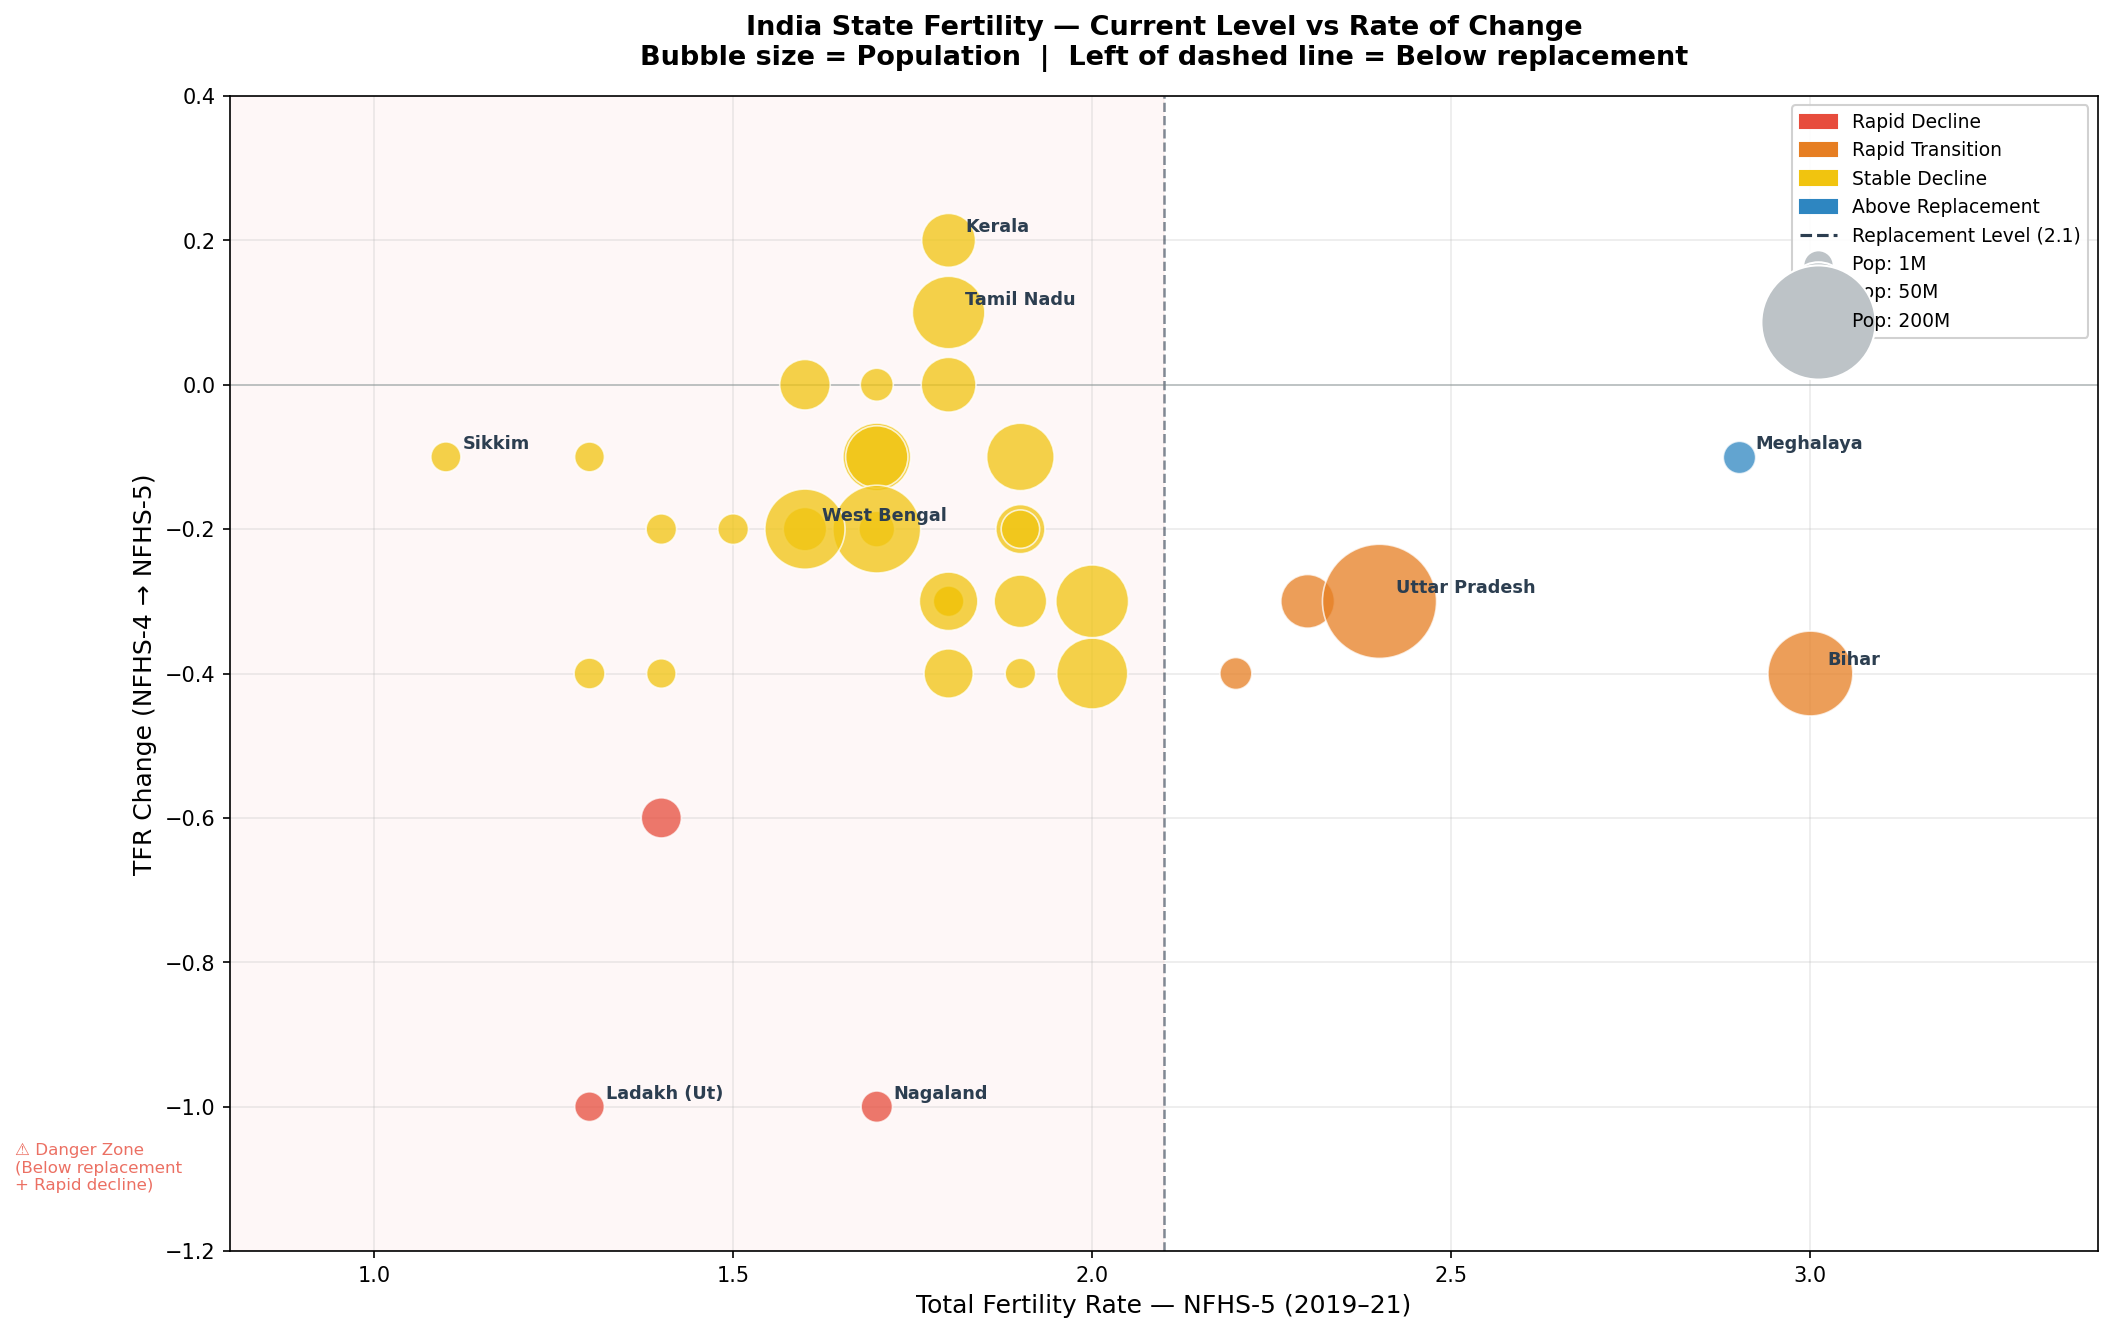
Nagaland and Ladakh dropped TFR by 1.0 in a single survey cycle. Kerala and Tamil Nadu show a rare positive tick — a potential recovery signal.
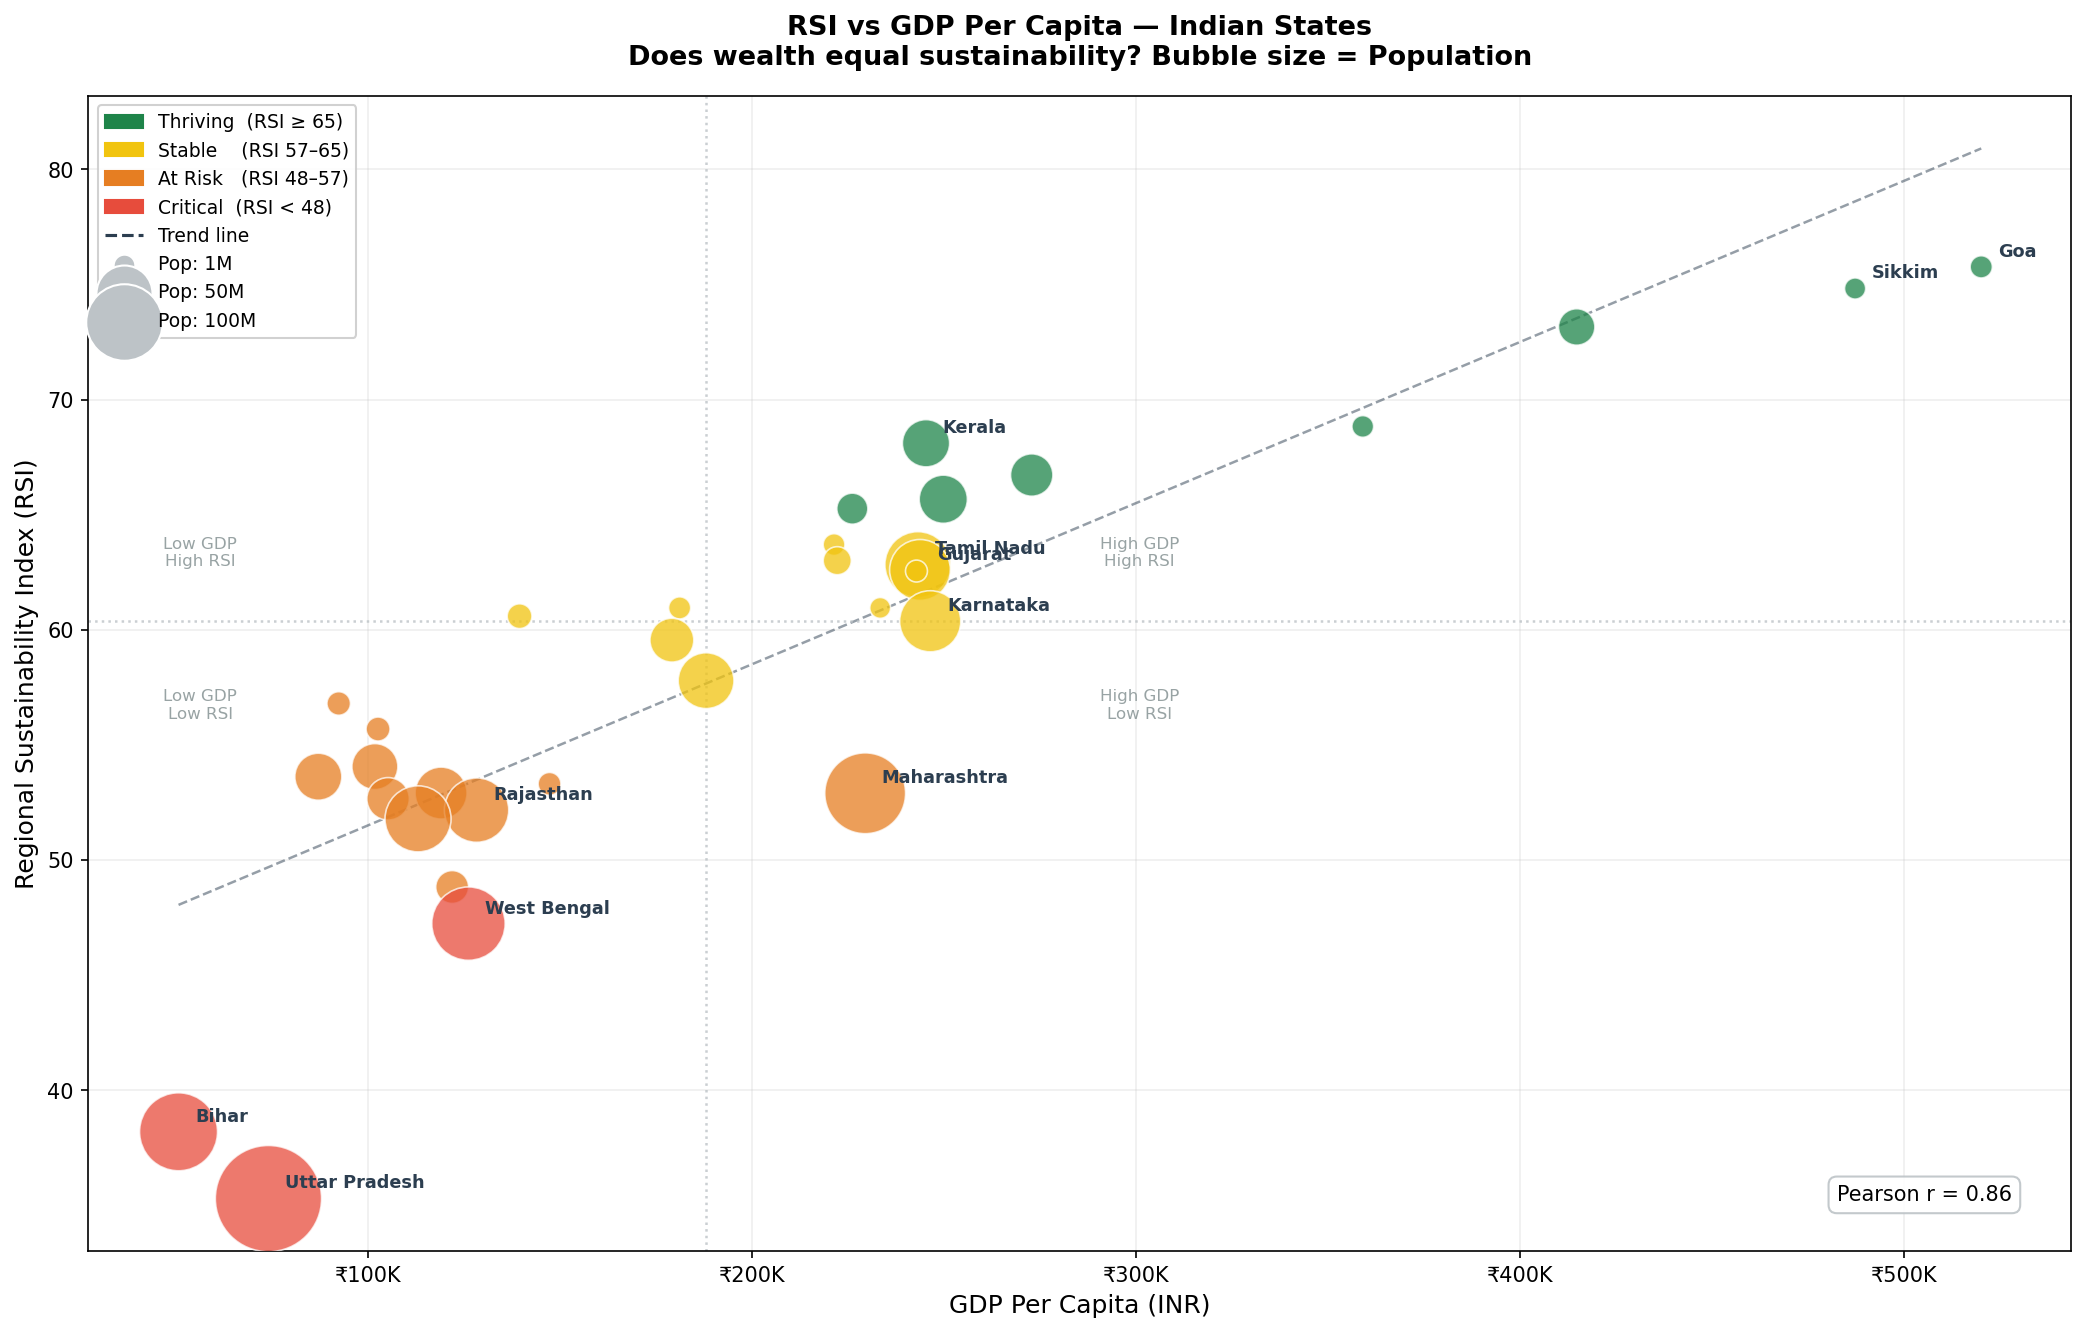
Strong but imperfect correlation. Kerala beats its GDP by +6.4 RSI points. Maharashtra underperforms by −7.7 despite being India's wealthiest state. Bihar underperforms even for its poverty level — a governance story, not just economics.
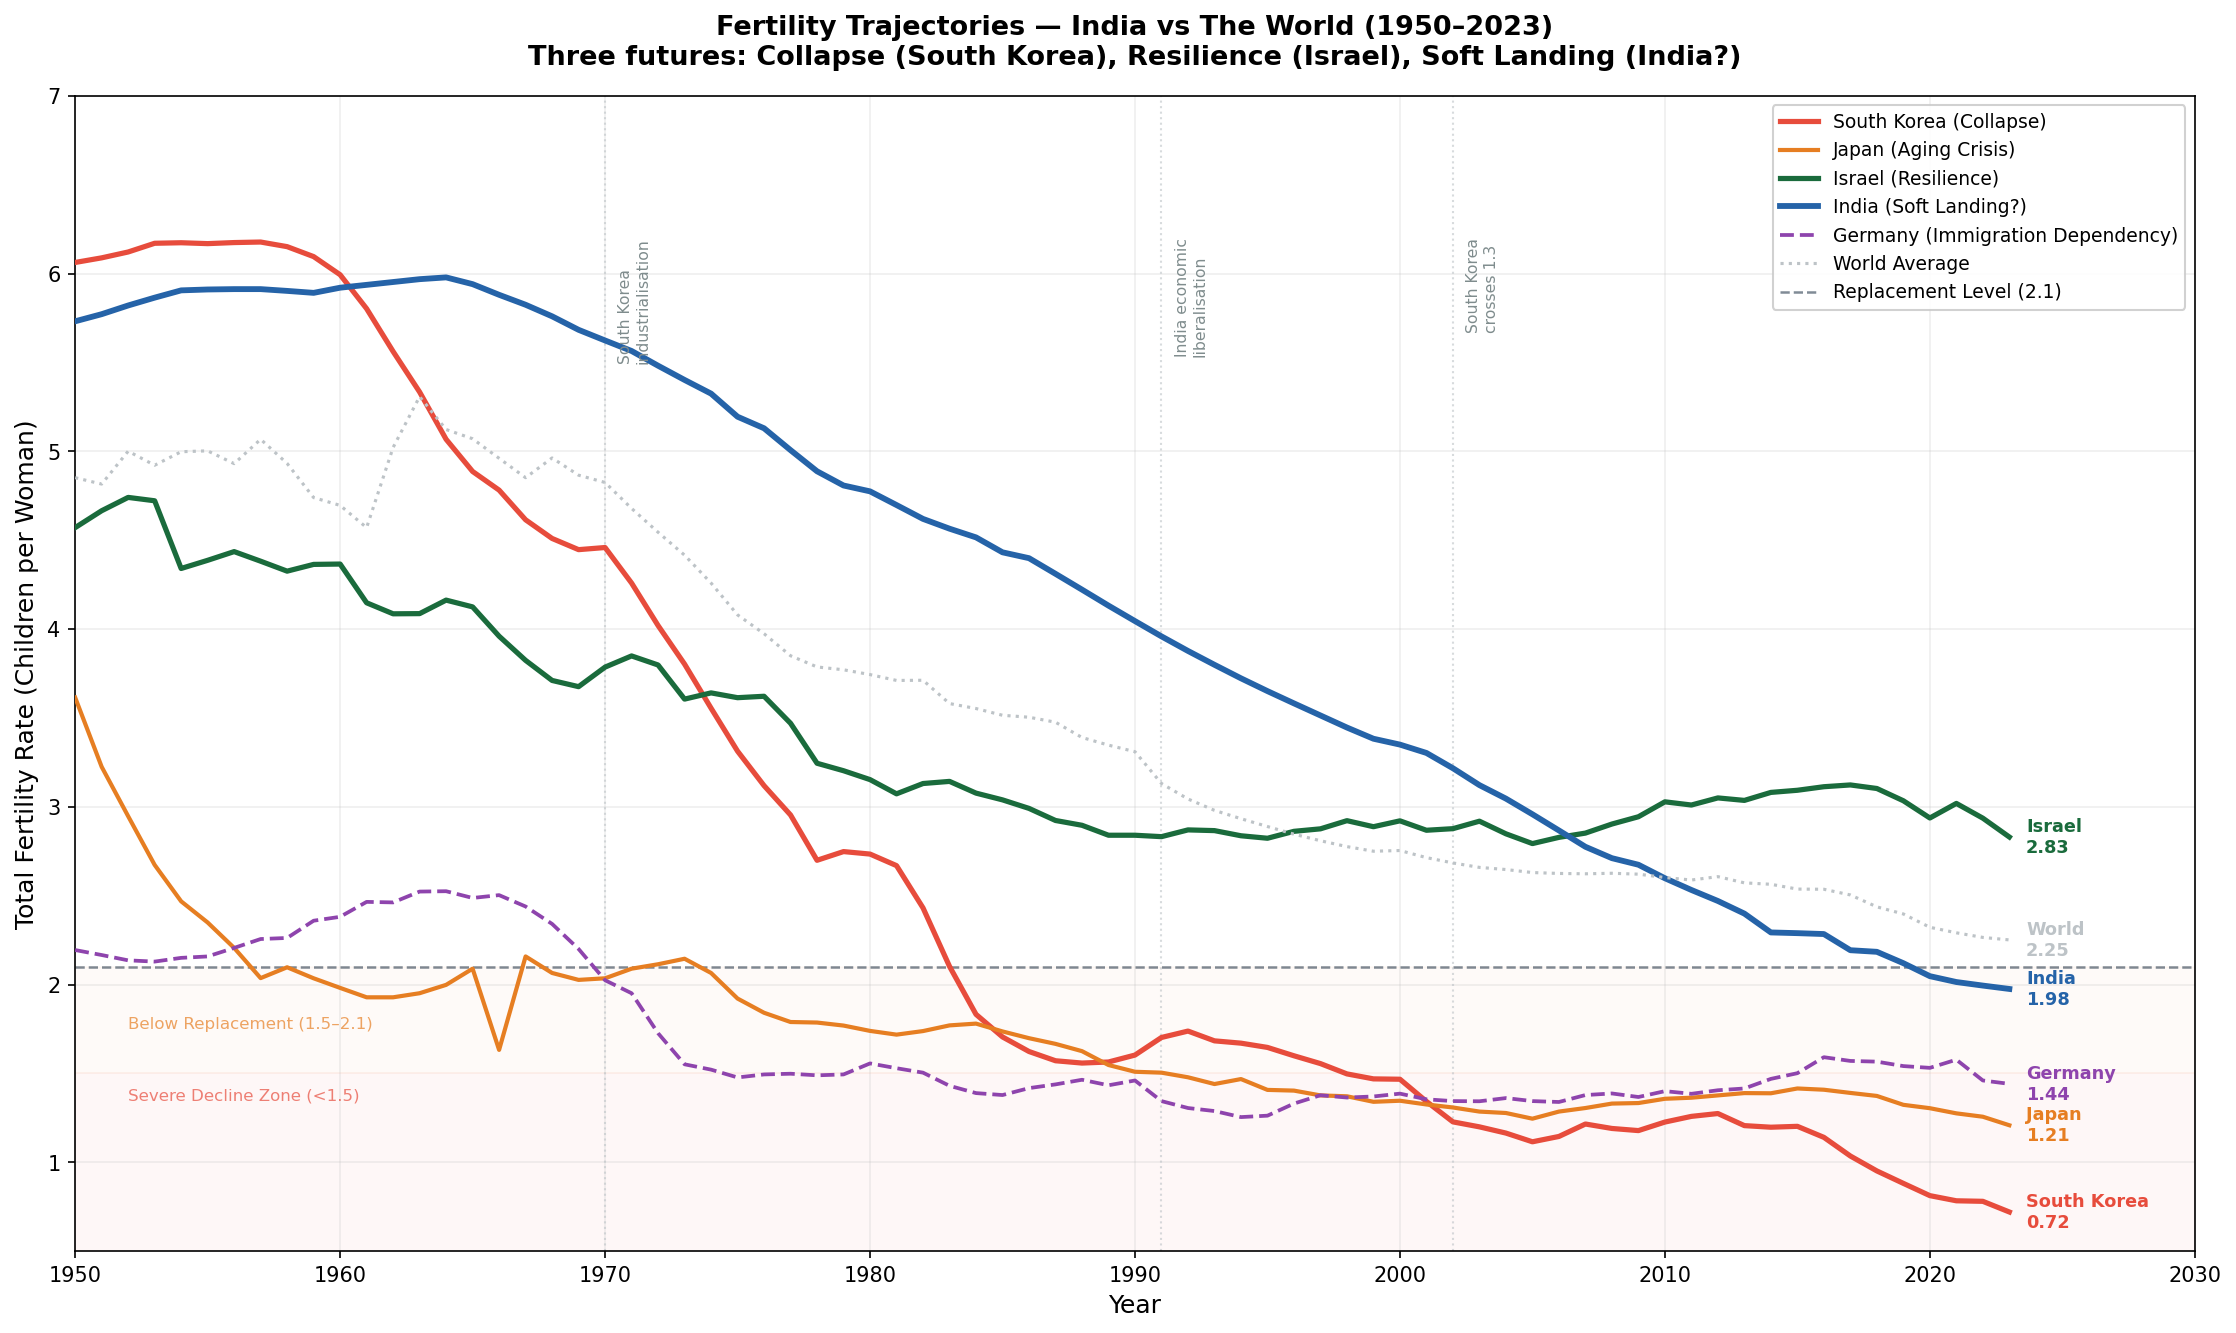
South Korea at 0.72 shows where unchecked decline leads. Israel at 2.83 shows that high-income resilience is possible. India at 1.98 is at exactly the inflection point South Korea passed in the late 1970s — just before its collapse accelerated.
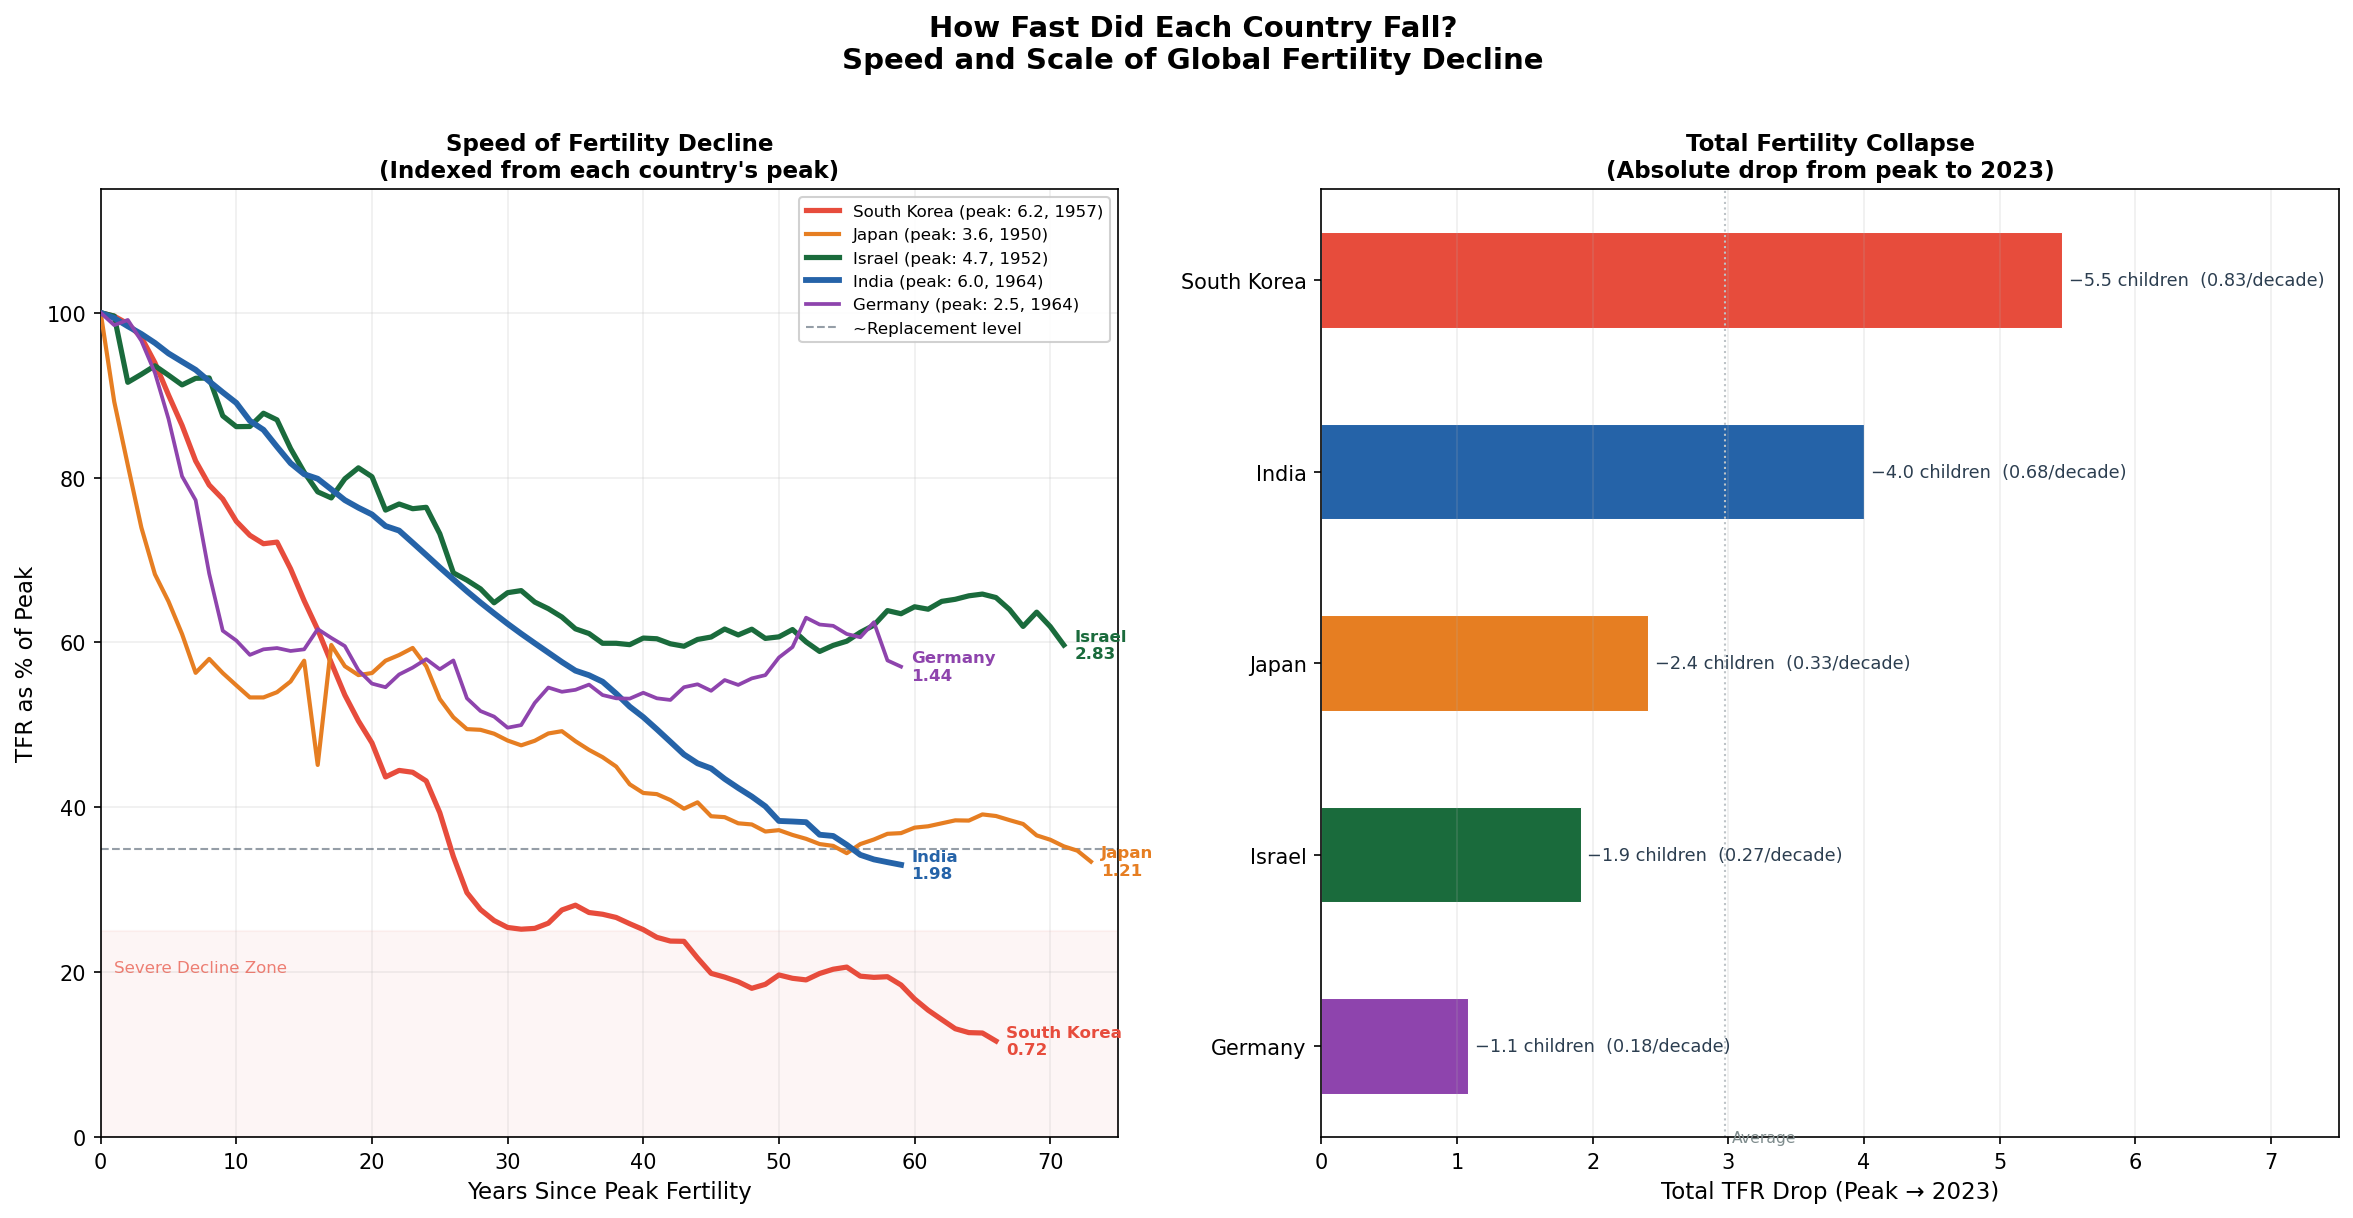
Indexed from each country's peak, India's decline rate of 0.68 children per decade is the second fastest in this dataset — faster than Japan (0.33) and Germany (0.18). The gradual appearance on absolute charts is misleading.